Concepts
Trace Collection
Skyramp Trace Collection
Introduction
This guide will show you how you can collect traces using Skyramp. Skyramp can function as a “Man-in-the-Middle” proxy that monitors your traffic and allows you to simply record the scenario you want to test. By following these simple steps, you'll be able to collect a trace that you can directly supply for the Skyramp test generation.
Prerequisites
Skramp CLI installed
Docker installed and running
Refer to the Installation Guide if you haven't installed Skyramp yet.
Start Trace Collection
This page is dedicated to collecting only network traffic triggered via the CLI. In additional guides, we will cover how to collect backend activity from a UI and full UI traces.
To start collecting traces, you need to run the following command. This command will spawn a new shell configured to collect all relevant network traffic. The first time you run this command, it might take a while to bring up Skyramp.
skyramp generate trace \
--include "https://demoshop.skyramp.dev/*" \
--runtime docker \
--output trace.json
Explanation of Command
--include: Specify a comma-separated list of FQDNs for Skyram to collect traces for.--runtime: Select the environment in which the Skyramp trace collector gets deployed. [Docker, Kubernetes]--output: Specify the name of the generated test file.
FQDNs need to be specified either as an exact path to the endpoint or in combination with a wildcard:
demoshop.skyramp.dev/productswill only collect traces for POST and GET of the products endpointdemoshop.skyramp.dev/products/*will also include all nested endpoints
For endpoints that require path parameters, please replace the path parameter with the wildcard:
Convert
demoshop.skyramp.dev/products/{product_id}/reviewstodemoshop.skyramp.dev/products/*/reviews
Additional Flags:
--exclude: Specify a comma-separated list of FQDNs for which you do not want Skyram to collect traces. This flag takes precedence over--includeif a FQDN is specified in both.--docker-network: Specify the name (string) of your Docker network.--docker-skyramp-port: Specify a port number for Skyramp (default=35142).
Record Scenario
For this guide, we show a simple scenario for the Demo Shop application: We add a new product, create a new order with that product, retrieve the order, and delete it. Refer to the Demo Shop documentation for additional details.
We are using curl to demonstrate the network calls, however, any network call that is made from the newly spawned shell will be collected by Skyramp (e.g. executing old tests).
Due to the proxy certificate handling, please ensure you use the
-kflag with curl
1. POST of a new product
curl -X POST https://demoshop.skyramp.dev/api/v1/products \
  -H "Content-Type: application/json" \
  -k \
  -d '{
    "name": "Macbook Pro",
    "description": "High-performance laptop",
    "price": 2499.99,
    "image_url": "https://images.app.goo.gl/jGPHo3ZEzEbHG8o2A",
    "category": "Laptop",
    "in_stock": true
  }'
2. POST of a new order
curl -X POST https://demoshop.skyramp.dev/api/v1/orders \
  -H "Content-Type: application/json" \
  -k \
  -d '{
    "customer_email": "abc@mail.com",
    "items": [
      {
        "product_id": 0,
        "quantity": 2,
        "unit_price": 2499.99
      }
    ]
  }'
3. GET of newly placed order
curl -X GET -k https://demoshop.skyramp.dev/api/v1/orders/04. DELETE of newly placed order
curl -X DELETE -k https://demoshop.skyramp.dev/api/v1/orders/0End Trace Collection
Once the scenario is completed, you can end the trace collection with Ctrl + D. You will see for which endpoints, Skyramp was able to collect traces:
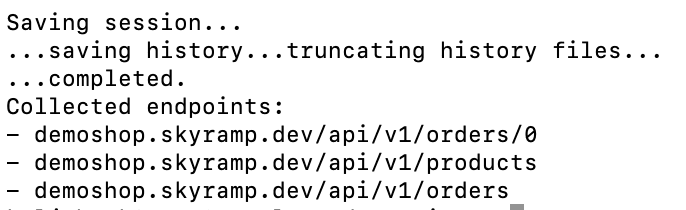
Additionally, it creates the trace.json file containing all collected traces. Each trace contains the following infromation:
Source
Destination
RequestBody
ResponseBody
RequestHeaders
ResponseHeaders
Method
Path
QueryParams
StatusCode
Port
Timestamp
Scheme
You can find a sample trace for the scenario above here.
Next Steps
Congratulations on collecting your first traces with Skyramp!
Related Topics
Skyramp Trace Collection
Introduction
This guide will show you how you can collect traces using Skyramp. Skyramp can function as a “Man-in-the-Middle” proxy that monitors your traffic and allows you to simply record the scenario you want to test. By following these simple steps, you'll be able to collect a trace that you can directly supply for the Skyramp test generation.
Prerequisites
Skramp CLI installed
Docker installed and running
Refer to the Installation Guide if you haven't installed Skyramp yet.
Start Trace Collection
This page is dedicated to collecting only network traffic triggered via the CLI. In additional guides, we will cover how to collect backend activity from a UI and full UI traces.
To start collecting traces, you need to run the following command. This command will spawn a new shell configured to collect all relevant network traffic. The first time you run this command, it might take a while to bring up Skyramp.
skyramp generate trace \
--include "https://demoshop.skyramp.dev/*" \
--runtime docker \
--output trace.json
Explanation of Command
--include: Specify a comma-separated list of FQDNs for Skyram to collect traces for.--runtime: Select the environment in which the Skyramp trace collector gets deployed. [Docker, Kubernetes]--output: Specify the name of the generated test file.
FQDNs need to be specified either as an exact path to the endpoint or in combination with a wildcard:
demoshop.skyramp.dev/productswill only collect traces for POST and GET of the products endpointdemoshop.skyramp.dev/products/*will also include all nested endpoints
For endpoints that require path parameters, please replace the path parameter with the wildcard:
Convert
demoshop.skyramp.dev/products/{product_id}/reviewstodemoshop.skyramp.dev/products/*/reviews
Additional Flags:
--exclude: Specify a comma-separated list of FQDNs for which you do not want Skyram to collect traces. This flag takes precedence over--includeif a FQDN is specified in both.--docker-network: Specify the name (string) of your Docker network.--docker-skyramp-port: Specify a port number for Skyramp (default=35142).
Record Scenario
For this guide, we show a simple scenario for the Demo Shop application: We add a new product, create a new order with that product, retrieve the order, and delete it. Refer to the Demo Shop documentation for additional details.
We are using curl to demonstrate the network calls, however, any network call that is made from the newly spawned shell will be collected by Skyramp (e.g. executing old tests).
Due to the proxy certificate handling, please ensure you use the
-kflag with curl
1. POST of a new product
curl -X POST https://demoshop.skyramp.dev/api/v1/products \
  -H "Content-Type: application/json" \
  -k \
  -d '{
    "name": "Macbook Pro",
    "description": "High-performance laptop",
    "price": 2499.99,
    "image_url": "https://images.app.goo.gl/jGPHo3ZEzEbHG8o2A",
    "category": "Laptop",
    "in_stock": true
  }'
2. POST of a new order
curl -X POST https://demoshop.skyramp.dev/api/v1/orders \
  -H "Content-Type: application/json" \
  -k \
  -d '{
    "customer_email": "abc@mail.com",
    "items": [
      {
        "product_id": 0,
        "quantity": 2,
        "unit_price": 2499.99
      }
    ]
  }'
3. GET of newly placed order
curl -X GET -k https://demoshop.skyramp.dev/api/v1/orders/04. DELETE of newly placed order
curl -X DELETE -k https://demoshop.skyramp.dev/api/v1/orders/0End Trace Collection
Once the scenario is completed, you can end the trace collection with Ctrl + D. You will see for which endpoints, Skyramp was able to collect traces:
Additionally, it creates the trace.json file containing all collected traces. Each trace contains the following infromation:
Source
Destination
RequestBody
ResponseBody
RequestHeaders
ResponseHeaders
Method
Path
QueryParams
StatusCode
Port
Timestamp
Scheme
You can find a sample trace for the scenario above here.
Next Steps
Congratulations on collecting your first traces with Skyramp!